📌 TL;DR
As the number of agents and capabilities in the platform grows, a central coordination layer becomes essential. The internal MCP (Model Context Protocol) server is that layer: a secure, discoverable registry of tools and agent capabilities, with built-in governance, audit logging, and system control APIs. This article covers the MCP server architecture — registry, execution engine, authentication, and the operational control endpoints that integrate with the monitoring stack.
⏮️ Previous: Breaking to Protect: Red Teaming Agentic Data Systems → | ⏭️ Next: Trust Through Traceability: Advanced Validation and OpenLineage Integration →
📖 Series context: In Part 13 — Breaking to Protect: Red Teaming Agentic Data Systems, we systematically attacked the multi-agent orchestration layer — probing for prompt injection, shared memory poisoning, and approval gate exploitation — and fed every finding back into OPA policy hardening. This article builds the infrastructure those security controls depend on: an internal MCP server that centralises tool registration, enforces OPA policy on every invocation, and provides a single audit trail across all agents. In Part 15 — Trust Through Traceability, we extend the trust model to the data layer with advanced validation and OpenLineage provenance tracking for every record.
💡 Quick stats: 4-step execution pipeline on every tool call (policy → validate → execute → audit) · 30-second default timeout prevents hung tools from blocking agent workflows · JWT agent identity read from verified token — not request body — prevents privilege escalation
❓ Why an Internal MCP Server
If you are building a multi-agent financial platform, the moment you have more than two or three agents you will hit three operational problems that cannot be patched away: duplicated tool implementations, inconsistent security postures, and zero visibility into which tool is being invoked by whom. An internal MCP server solves all three — it becomes the single source of truth for what tools exist, what they do, and what happened when they were used. Here is what the pain looks like without one.
- 👁️ Tool duplication: Multiple agent developers independently implemented the same capabilities — data validation, OPA policy evaluation, Kafka publishing — because there was no shared registry. Duplicate implementations diverged over time, creating inconsistencies.
- ⚙️ Security drift: Agent tools had inconsistent security postures. Some validated inputs rigorously; others trusted their callers. There was no enforcement layer that required all tools to meet a minimum security standard.
- ⚡ No operational visibility: There was no single place to see which tools were in use, which agents were invoking them, or how often. When a tool failed, diagnosing the issue required checking multiple separate logs.
The internal MCP server solves all three by acting as the single source of truth for agent capabilities — what tools exist, what they do, who can invoke them, and what happened when they were invoked. This pairs directly with the LangGraph orchestration layer from Part 12, where agent nodes call tools as part of their state transitions.
↑ Back to top · Next: Architecture Overview →
🏗️ Architecture Overview
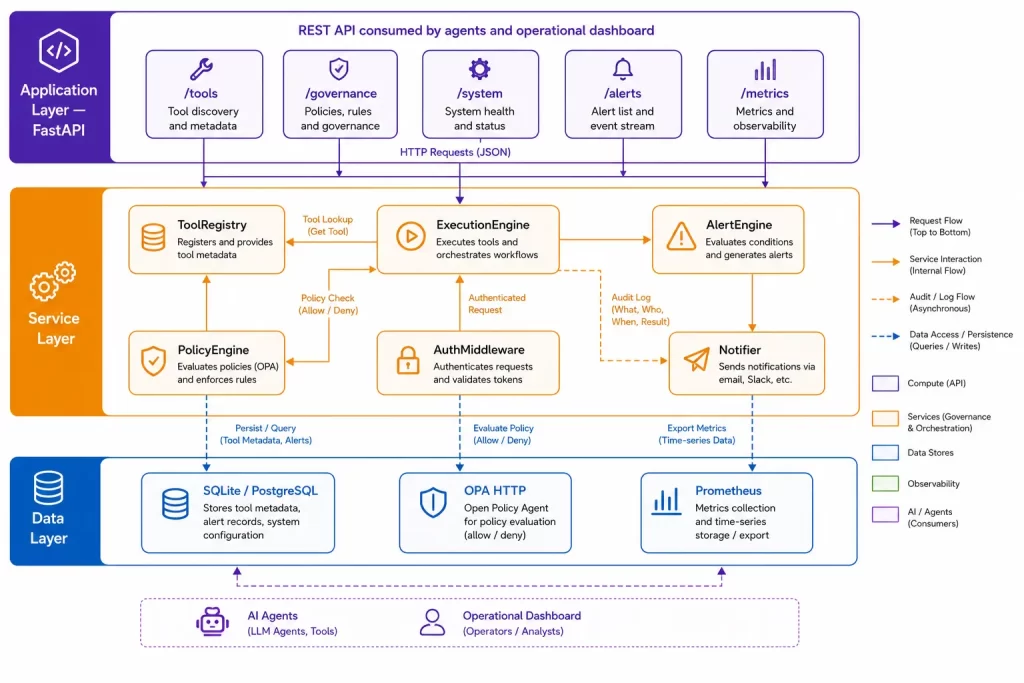
The MCP server follows a layered architecture:
┌─────────────────────────────────────────────┐
│              FastAPI Application             │
│  /tools  /governance  /system  /alerts  /metrics│
├─────────────────────────────────────────────┤
│              Service Layer                  │
│  ToolRegistry  ExecutionEngine  AlertEngine │
│  PolicyEngine  AuthMiddleware   Notifier    │
├─────────────────────────────────────────────┤
│              Data Layer                     │
│  SQLite/PostgreSQL  OPA HTTP  Prometheus    │
└─────────────────────────────────────────────┘
The application layer exposes REST endpoints consumed by agents and the operational dashboard. The service layer contains the business logic. The data layer persists tool metadata and alert records, and integrates with OPA for policy enforcement and Prometheus for metrics export.
↑ Back to top · Next: The Tool Registry →
📚 The Tool Registry
The ToolRegistry is the heart of the MCP server. It maintains a persistent catalog of every registered tool:
class ToolRegistry:
    def __init__(self):
        init_db()           # Ensure schema exists
        self.seed_tools()   # Load bootstrap tools from seed file

    def list_tools(self, capability: str | None = None) -> List[ToolDescriptor]:
        with SessionLocal() as session:
            tools = session.query(ToolDB).all()
            if capability:
                tools = [t for t in tools if capability in t.capabilities]
            return [t.to_descriptor() for t in tools]

    def get_tool(self, tool_id: str) -> ToolDescriptor | None:
        with SessionLocal() as session:
            tool = session.get(ToolDB, tool_id)
            return tool.to_descriptor() if tool else None

    def create_tool(self, tool: ToolDescriptor) -> ToolDescriptor:
        with SessionLocal() as session:
            tool_db = ToolDB.from_descriptor(tool)
            session.add(tool_db)
            session.commit()
            session.refresh(tool_db)
            return tool_db.to_descriptor()

    def seed_tools(self) -> None:
        if not SEED_FILE.exists():
            return
        with open(SEED_FILE, "r", encoding="utf-8") as f:
            data = json.load(f)
        for tool_data in data.get("tools", []):
            tool = ToolDescriptor(**tool_data)
            if not self.get_tool(tool.id):
                self.create_tool(tool)
The seed file (apps/mcp_server/config/tools_seed.json) bootstraps the registry with the platform’s built-in tools on first startup:
{
  "tools": [
    {
      "id": "validate_transaction",
      "name": "Transaction Validator",
      "description": "Validate a financial transaction against configured business rules. Returns validation result with specific rule failures.",
      "capabilities": ["validation", "data_quality"],
      "input_schema": {
        "type": "object",
        "properties": {
          "transaction_type": {"type": "string"},
          "amount": {"type": "number", "minimum": 0},
          "currency": {"type": "string", "pattern": "^[A-Z]{3}$"}
        },
        "required": ["transaction_type", "amount", "currency"]
      },
      "security_level": "internal",
      "owner": "data-platform-team"
    },
    {
      "id": "evaluate_opa_policy",
      "name": "OPA Policy Evaluator",
      "description": "Evaluate a governance policy for a given input. Returns allow/deny decision with reasons.",
      "capabilities": ["governance", "compliance"],
      "input_schema": {
        "type": "object",
        "properties": {
          "policy_path": {"type": "string"},
          "input": {"type": "object"}
        },
        "required": ["policy_path", "input"]
      },
      "security_level": "restricted",
      "owner": "compliance-team"
    }
  ]
}
The description field is critical — it is what agents read when deciding which tool to use for a given task. A tool with a vague description (“does something with data”) will be misused or ignored. A tool with a precise description is reliably selected by the LLM planner.
↑ Back to top · Next: The Execution Engine →
⚙️ The Execution Engine
Every tool invocation goes through the ExecutionEngine, which applies security checks, input validation, and audit logging:
class ExecutionEngine:
    def __init__(self, registry, policy_engine, auditor):
        self.registry = registry
        self.policy_engine = policy_engine
        self.auditor = auditor

    async def invoke_tool(
        self,
        tool_id: str,
        payload: dict,
        agent_context: dict,
    ) -> ToolResult:
        tool = self.registry.get_tool(tool_id)
        if tool is None:
            raise ToolNotFoundError(f"Tool '{tool_id}' not registered")

        # Step 1: Policy check
        allowed = self.policy_engine.check_tool_access(
            agent_id=agent_context["agent_id"],
            tool_id=tool_id,
            payload=payload,
        )
        if not allowed:
            raise ToolAccessDeniedError(
                f"Agent '{agent_context['agent_id']}' denied access to tool '{tool_id}'"
            )

        # Step 2: Input validation against schema
        validation_errors = self.validate_input(payload, tool.input_schema)
        if validation_errors:
            raise InvalidInputError(f"Input validation failed: {validation_errors}")

        # Step 3: Execute with timeout
        try:
            result = await asyncio.wait_for(
                self._dispatch(tool, payload),
                timeout=30.0,
            )
        except asyncio.TimeoutError:
            raise ToolTimeoutError(f"Tool '{tool_id}' exceeded 30s timeout")

        # Step 4: Audit log
        await self.auditor.record_invocation(
            agent_id=agent_context["agent_id"],
            tool_id=tool_id,
            payload=payload,
            result=result,
        )

        return result
The four-step sequence — policy check, input validation, execution with timeout, audit log — is non-negotiable. Every tool invocation follows it, regardless of which tool is called. An agent cannot bypass the policy check by invoking a tool directly; all tool invocations are routed through the execution engine.
The timeout prevents a slow or hung tool from blocking the agent workflow indefinitely. 30 seconds is the default; individual tools can declare shorter timeouts in their registry entry. The OPA policy check in Step 1 uses the same zero-trust policy engine built in Part 11 — the MCP server is where those governance rules are enforced at the tool call site.
💡 Pro tip: The four-step execution pipeline — policy check, validate, execute, audit — should be enforced at the infrastructure level, not by convention. If agents can invoke tools by calling functions directly, one developer skipping the convention will silently introduce an unaudited, ungoverned execution path.
↑ Back to top · Next: Authentication and Agent Identity →
🔑 Authentication and Agent Identity
The authentication middleware validates every request before it reaches the tool registry or execution engine:
class AuthMiddleware:
    def __init__(self, secret_key: str):
        self.secret_key = secret_key

    def validate_token(self, token: str) -> dict:
        try:
            payload = jwt.decode(token, self.secret_key, algorithms=["HS256"])
            return payload
        except jwt.ExpiredSignatureError:
            raise AuthenticationError("Token expired")
        except jwt.InvalidTokenError:
            raise AuthenticationError("Invalid token")

    async def __call__(self, request: Request, call_next):
        auth_header = request.headers.get("Authorization")
        if not auth_header or not auth_header.startswith("Bearer "):
            raise HTTPException(status_code=401, detail="Missing authentication token")
        token = auth_header.split(" ")[1]
        agent_context = self.validate_token(token)
        request.state.agent_context = agent_context
        return await call_next(request)
Agent tokens are short-lived JWTs issued by the platform’s identity service. The token contains the agent’s identity (agent_id), its registered capabilities, and an expiry. The execution engine uses the agent_id from the token — not from the request body — for policy evaluation. This prevents an agent from claiming a different identity in its request payload.
↑ Back to top · Next: System Control APIs →
🎛️ System Control APIs
The MCP server exposes operational control endpoints that integrate with the monitoring dashboard:
@router.post("/api/system/generator/start")
async def start_generator(background_tasks: BackgroundTasks):
    """Start the synthetic data generator."""
    background_tasks.add_task(run_generator)
    return {"status": "generator_starting"}

@router.post("/api/system/generator/stop")
async def stop_generator():
    """Stop the synthetic data generator."""
    generator_state.running = False
    return {"status": "generator_stopping"}

@router.post("/api/system/pipeline/run")
async def trigger_pipeline(background_tasks: BackgroundTasks):
    """Trigger a pipeline batch run."""
    background_tasks.add_task(run_pipeline_batch)
    return {"status": "pipeline_triggered"}

@router.get("/api/system/status")
async def system_status():
    """Return current system health and component status."""
    return {
        "generator": generator_state.status(),
        "pipeline": pipeline_state.status(),
        "kafka": check_kafka_connectivity(),
        "database": check_database_connectivity(),
        "opa": check_opa_connectivity(),
    }

@router.get("/metrics")
async def metrics():
    """Prometheus metrics endpoint."""
    return Response(
        content=generate_latest(),
        media_type=CONTENT_TYPE_LATEST,
    )
These endpoints enable the Grafana dashboard (and the operational UI) to control platform components through the same secure channel used by agents. Starting or stopping data generation, triggering pipeline runs, and querying system health are all MCP server operations — they go through the same authentication and audit logging as tool invocations.
↑ Back to top · Next: Alert Engine Integration →
🔔 Alert Engine Integration
The MCP server hosts the alert engine that aggregates alerts from all platform components:
class AlertEngine:
    def __init__(self):
        self.rules: List[AlertRule] = []
        self.channels: List[NotificationChannel] = []

    def trigger_alert(
        self,
        severity: str,
        message: str,
        source: str,
        details: dict,
    ) -> None:
        alert = Alert(
            severity=severity,
            message=message,
            source=source,
            details=details,
            timestamp=datetime.now(),
        )
        for rule in self.rules:
            if rule.matches(alert):
                for channel in rule.channels:
                    channel.send(alert)
        self._store_alert(alert)
        self._emit_prometheus_metric(alert)
Pipeline stages, agents, and governance components all call the alert engine through a callback injected at configuration time. The MCP server is the single point where all alerts are collected, evaluated against rules, and dispatched to notification channels. This centralises alert management and prevents notification fragmentation across multiple services.
↑ Back to top · Next: Client SDK →
🧰 Client SDK
A client SDK makes it straightforward for agents and other services to discover and invoke tools:
from libs.mcp_client import MCPClient

client = MCPClient(
    base_url="http://mcp-server:8080",
    agent_token=get_env("MCP_AGENT_TOKEN"),
)

# Discover tools by capability
validation_tools = client.list_tools(capability="validation")

# Invoke a tool
result = client.invoke_tool(
    "validate_transaction",
    {
        "transaction_type": "payment",
        "amount": 1500.0,
        "currency": "USD",
    }
)

if not result.success:
    logger.warning("Validation failed: %s", result.errors)
The SDK handles token injection, error handling, and response parsing. Agents work with ToolResult objects rather than raw HTTP responses, reducing the boilerplate in agent code.
↑ Back to top · Next: Frequently Asked Questions →
❓ Frequently Asked Questions
Common questions about building an internal MCP server for multi-agent coordination answered from real-world implementation experience.
What is an internal MCP server and why do multi-agent systems need one?
An internal MCP (Model Context Protocol) server is a centralised registry and execution layer for agent tools. Without one, every new agent brings its own tool implementations — with different input schemas, security postures, and logging conventions. Over time, tool duplication creates inconsistencies, security drift creates ungoverned invocation paths, and the lack of central logging creates operational blind spots. The MCP server is the single source of truth: what tools exist, who can invoke them, and what happened.
How does the MCP execution engine enforce security on every tool invocation?
The ExecutionEngine enforces a four-step pipeline on every invocation: (1) OPA policy check — the agent’s identity is verified and its access to the requested tool is evaluated against governance rules; (2) input validation against the tool’s JSON schema; (3) execution with a 30-second timeout to prevent hung tools from blocking agent workflows; (4) audit log recording the agent, tool, payload, and result. No tool bypasses this pipeline — it is enforced by infrastructure, not convention.
How do agents authenticate with the MCP server?
Agents authenticate using short-lived JWT tokens issued by the platform’s identity service. Each token contains the agent’s agent_id, its registered capabilities, and an expiry timestamp. The AuthMiddleware validates the token on every request before routing it to the execution engine. Critically, the execution engine reads agent_id from the verified token — not from the request body — so an agent cannot claim a different identity or elevated permissions in its payload.
Why are tool descriptions so important in an agent tool registry?
The tool description is the interface the LLM planner reads when deciding which tool to invoke for a given task. A vague description like “does something with data” causes the planner to either misuse the tool or ignore it entirely. A precise description — “Validate a financial transaction against configured business rules. Returns validation result with specific rule failures.” — allows the planner to select the right tool reliably. Tool descriptions are agent-facing contracts, not developer documentation.
↑ Back to top · Next: Key Takeaways →
🔑 Key Takeaways
- The MCP server solves the three multi-agent scaling problems — tool duplication, inconsistent security postures, and operational invisibility; centralising the tool registry eliminates divergent implementations and enforces a minimum security standard on every capability.
- The four-step execution pipeline is non-negotiable for every tool invocation — policy check → input validation → timed execution → audit log; enforce it at the infrastructure level so no agent can invoke tools by bypassing the execution engine through direct function calls.
- Tool descriptions are agent-facing contracts, not developer documentation — the LLM planner reads the description to decide which tool to invoke; a vague description causes misuse or omission; invest in precise, specific capability descriptions for reliable tool selection.
- System control APIs unify platform operations through the same secure channel — starting/stopping generators, triggering pipeline runs, and querying system health all go through authentication and audit logging, eliminating the risk of a separate unsecured admin interface.
- The alert engine hosted in the MCP server prevents notification fragmentation — pipeline stages, agents, and governance components all call the same callback; all alerts flow through the same rules and channels from a single audit point.
- Short-lived JWT tokens for agent identity prevent privilege escalation — the execution engine reads
agent_idfrom the verified token, not from the request body; an agent cannot claim a different identity or elevated permissions by modifying its payload.
🙏 Thank You, Reader
Thank you for reading. The MCP server is the invisible infrastructure that makes a multi-agent system coherent — without a central registry and execution engine, every new agent brings new security debt and new operational blind spots. The next article covers data trust: how advanced validation and OpenLineage integration give every record a traceable, auditable provenance chain.
📫 Connect With Me
- 💼 LinkedIn: Connect with me on LinkedIn
- 💻 GitHub
Enjoyed this article?
Get notified when the next one is published.
We send one email per new article — no spam, unsubscribe any time.
⚠️ Disclaimer: The information provided on LearnWithNeeraj.com regarding Astrology, Numerology, and other topics is for educational and guidance purposes only.
Not Professional Advice: This content should not be used as a substitute for professional medical, legal, or financial advice. Always consult a certified professional for specific concerns.
Guest Authors: This site features articles by various contributors. The views and interpretations expressed are those of the individual authors and do not necessarily reflect the views of the website administrator.
Your destiny is in your hands. Use this information as a map, not a mandate.