TL;DR
Fairness checks compare outcomes across groups. A SHAP explanation estimates how inputs contribute to a score, while drift monitoring tracks changes in data. Using our banking platform as a case study, this article follows one practical question: when a monitor flags a change, how does a team turn it into a decision and action?
Previous: Model Risk, Agentic Risk Management, and the Observability Gap | Next: Threat Modeling AI Systems: STRIDE, PASTA, and MITRE ATLAS
In This Article
What the topic is about
Why it is important in our project
How it was implemented in our project
Real challenges and learning while we implemented it
🧩 Production AI Governance Needs a Human Handoff
Consider a configured example: a daily Population Stability Index (PSI) check scores 0.27, which the project labels major drift. Incident handling does not automatically raise priority. How does that signal reach a reviewer and lead to follow-up?
Several governance references focus on this handoff:
- SR 26-2 calls for risk-based model oversight.
- The NIST AI Risk Management Framework connects ownership, risk assessment, measurement, and response.
- ISO/IEC 42001 sets requirements for an organisational AI management system.
In practice, that means checking the signal, reviewing evidence, recording a decision, and tracking the action. See how audit trails support accountable decisions.
The Same Questions Cross Industry Lines
The same review question applies beyond banking. These healthcare and automotive examples are illustrative, not features of this platform.
| Setting | Signal and evidence to check | Who reviews and what may follow |
|---|---|---|
| Banking (case study) | Group outcome rates differ. Check the outcome definition, group sizes, label quality, and relevant decision rules. | Risk and compliance reviewers determine whether to investigate data, eligibility rules, or policy, and record their rationale. |
| Healthcare (illustrative) | A triage tool sends more patients for urgent review after a change in patient mix or workflow. Compare acuity, missing information, and alert rates. | A clinical lead checks whether patient need or workflow explains the shift; focused chart review or validation may follow. |
| Automotive (illustrative) | A perception system misses more objects in rain, at night, or after a sensor or software update. Compare results by scenario and sensor configuration. | Safety engineers assess failure severity and test coverage, then may expand testing or restrict a release. |
In each case, a metric starts an inquiry; a domain expert checks the evidence and chooses a response. The next section applies this to the platform’s customer outcomes.
Back to top . Next: Fairness Auditing
⚖️ Fairness Auditing: What Group Comparisons Can Tell Us
Fairness checks compare recorded outcomes across customer groups. They can show where rates differ, but reviewers need more evidence to understand why and decide what to do.
The audit compares three recorded outcomes—Murabaha eligibility, high-risk status, and Sharia compliance—across nationality, income band, customer segment, and risk tier in the curated analytics data (Gold layer). It compares stored labels, not model predictions against actual outcomes. The 0.80 and 0.10 values below are this project’s review triggers.
One detail changes how to read the results: a label of 1 means eligible or compliant for two outcomes, but means high risk for the third. Because the 0.80 ratio assumes 1 is favorable, its high-risk comparison points the other way. Missing Sharia-compliance labels are filled as “compliant,” so check source labels before relying on that comparison.
The checks below find different gaps; Fairlearn’s guide explains how to choose and interpret group measures.
| Check | Project review trigger | How to read it in this audit |
|---|---|---|
| Disparate-impact and group-rate ratios | Below 0.80 | Compares group outcome rates. The high-risk label reverses the usual favorable-outcome reading. |
| Demographic-parity difference | Above 0.10 (10 percentage points) | Shows the largest gap in positive-label rates; it does not explain the cause. |
| Equalized-odds difference | Configured at 0.10; current input is unsuitable | The check needs model predictions and actual outcomes. This audit supplies the same stored label for both, so its result cannot measure model error gaps. |
How it works here: Each outcome is audited separately on Gold-layer customer data. Fairlearn calculates group differences, while AI Fairness 360 supplies the disparate-impact ratio. The workflow saves an HTML report and run metrics, and can open an incident when a check fails.
In the scheduled workflow, the three outcomes are separate audit runs. Each run saves its report to object storage and its result to the audit database; failed checks can also create an incident. That makes findings traceable by outcome and run, but reviewers still need to confirm the source labels and investigate the flagged groups.
To adopt it: Start with one decision and define exactly what a positive outcome means. Build a dataset with one row per decision, the group attributes you are permitted to use, and verified outcome labels. Compare group rates, inspect sample sizes and missing labels, then route flagged results to a reviewer. For error-rate comparisons, use the model’s predictions alongside actual outcomes; do not substitute the outcome label for both. Set thresholds for your decision context rather than copying these project values.
Group comparisons show patterns across customers; SHAP looks at the inputs behind one score.
Back to top . Next: SHAP Explains One Scoring Step
💡 SHAP Explains One Scoring Step
SHAP shows which inputs moved a score; it does not automatically produce a sound explanation for a customer. For creditors covered by U.S. Regulation B, notices must give specific reasons, with further requirements for requested explanations in the CFPB interpretation.
How it works here: Kernel SHAP explains a softened scoring function that mirrors one Murabaha eligibility step—not the separate trained credit model or the full customer decision. It uses five inputs:
- Credit score
- Debt-burden ratio
- Identity verification
- Politically exposed person status
- Defaults in the last 24 months
Its reference is a sample of up to 200 platform profiles; if those records cannot load, the service uses 100 synthetic profiles. Because the reference population shapes contributions, identify which baseline produced each explanation.
For each customer request, the service passes the profile through that scoring function and returns the feature contributions with their direction. This is useful for examining the implemented eligibility step; it should not be presented as an explanation of a different trained model or of the entire approval process.
The service turns saved contributions into short reason statements; without them, it returns no detailed reasons. Check any wording against the decision and applicable notice rules before sharing.
To adopt it: Explain the exact scoring function used in the decision, select a representative reference population, and test explanations on known cases. Review contribution wording against the final decision and group-level results before using it in customer notices.
That explanation covers one score. Drift monitoring looks instead at whether the wider input data changes over time.
Back to top . Next: Drift Monitoring
📈 Drift Monitoring: Reading a Moving Baseline
A shift in customer data can reflect changing conditions—or a broken data feed. Drift scores show where to look; source records and operating context help explain why.
How it works here: A daily Evidently check compares four features in curated customer data—credit score, debt burden, risk tier, and customer segment—with a rolling 30-day baseline. It stores daily summaries to build that baseline and starts PSI checks after a warm-up; each feature needs at least 30 current values. The bands below prioritize review; they do not measure model accuracy. See how data pipelines shape AI inputs.
For each feature, the monitor reconstructs a reference distribution from the saved mean, spread, and percentile summaries, calculates PSI against current values, then stores the run and routes detected drift to alert and incident handling. The summaries make a rolling comparison possible without retaining each baseline row in this check, but they also mean the reference is an approximation.
Each band tells the team how closely to investigate:
| PSI for a feature | Project label | Review implication |
|---|---|---|
| Below 0.10 | Stable | No drift alert under this band; continue routine monitoring. |
| 0.10 to below 0.25 | Minor drift | Review the feature change and operating context. |
| 0.25 or higher | Major drift | Investigate the change and check performance against outcome data. |
The reference is reconstructed from saved summary statistics, not replayed raw records, so inspect source data when a score rises. Thresholds are read from governed configuration rather than hard-coded; missing values stop the check and should be reported separately from a measured result.
To adopt it: Pick features tied to real operating risks, save comparable snapshots, and allow enough history to establish a baseline. Set thresholds through an approved configuration, test them on historical periods, and define who investigates each alert. Check later outcomes separately to learn whether the shift affected model performance. Daily drift monitoring and annual model revalidation answer different questions; keep their results separate.
Back to top . Next: Turning a Signal Into a Reviewed Decision
🔄 Turning a Signal Into a Reviewed Decision
A number starts the review; it does not finish it. Reviewers check the data, record a decision, and assign the next step. See how human review can fit into an agent workflow.
Make Alert Thresholds Match the Response
The drift monitor calls 0.25 or higher major; incident handling raises default priority only above 0.30. In this configured example, 0.27 is major drift without an automatic priority increase. An unchanged priority is not a clean result—the monitor’s severity and the incident’s priority need to be read together.
How it works here: A detected drift run is stored with its data window and result, then can emit an audit event, publish an alert, and create an incident. These automated steps route the signal; they do not record a human investigation or complete its follow-up. Automatic incident priority is a separate rule, as the 0.27 example shows.
To adopt it: Route each alert to a named owner. Link the run details to the review record; capture the evidence checked, the decision and rationale, the action owner, and completion evidence. Test scores just below, at, and above each monitoring and incident threshold so no interval is left without a response.
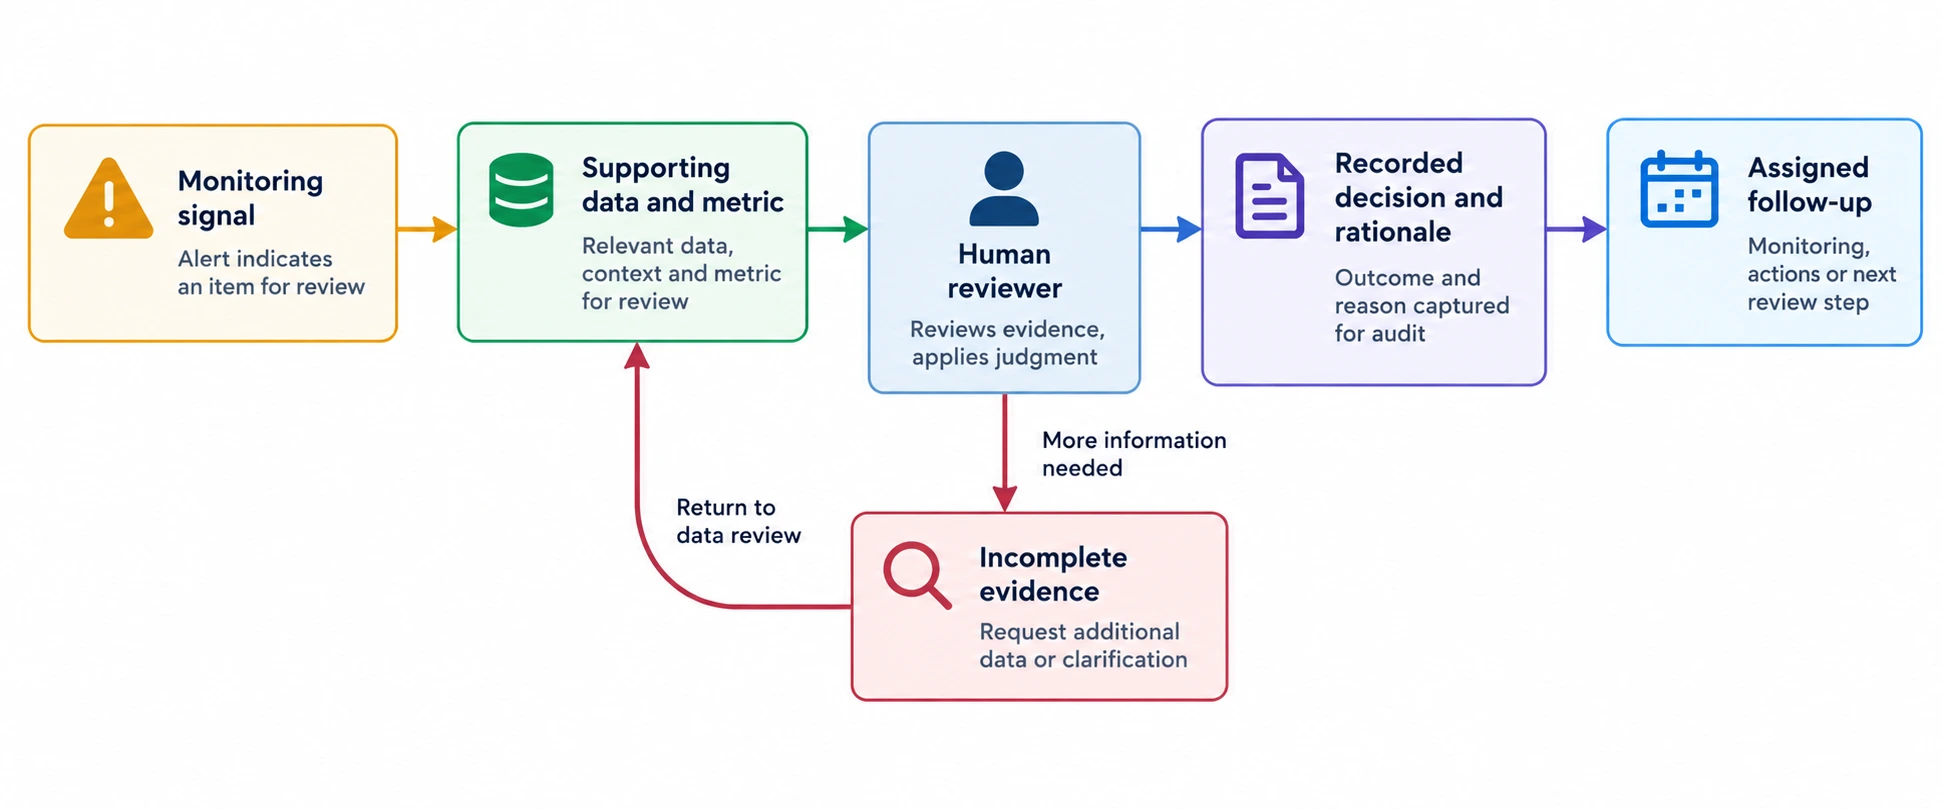
Customers can report concerns that the system links to an incident. Staff still need a procedure to investigate appeals and explain outcomes.
Back to top . Next: Early Data Checks
🔒 Early Data Checks Flag Suspicious Patterns
Before drift monitoring, simple rules flag unusual values and patterns in incoming batches. They identify anomalies; a reviewer still needs evidence to understand the cause.
How it works here: In incoming raw customer batches (the Bronze layer), the project checks three patterns:
- Credit scores outside the configured low and high limits; the check flags that row.
- A batch larger than the configured multiplier of its 30-day average; the seeded multiplier is three.
- Duplicate customer IDs with conflicting field values; the check flags every row for that ID.
Suspect rows are copied to a quarantine location, but the original Bronze data remains and promotion continues. The checks add a review path; they do not stop affected records from moving through the pipeline.
The ingestion step reads the current batch, applies the row-level flags, and writes flagged rows to a separate object-storage path. A batch-size anomaly is recorded for the batch, not assigned to particular customer rows. If the quarantine write fails, ingestion logs a warning and continues, so the write and downstream behavior need explicit operational monitoring.
To adopt it: Define valid ranges from the data contract, compare batch size with a stable historical window, and flag duplicate keys only when their other fields conflict. Store suspect rows with the reason and source batch. If poisoning is a concern, use MITRE ATLAS to guide investigation. Decide whether your risk requires review-only quarantine, a hold, or a hard block, and verify the production path follows that decision.
🔧 Choosing Tools for Different Checks
Choose tools for the check you need and the environment you run. No single tool covers every question in this article.
Why this stack: This Python pipeline uses Evidently for drift, Fairlearn and AI Fairness 360 for group measures, and SHAP for score contributions. Together they support the checks described above; the project configures and connects them to its own data and review flow. Teams already operating in Azure may prefer its Responsible AI dashboard. NannyML Cloud offers a different fit when outcome labels arrive late. Compare metric definitions, data handling, integration, and ownership before choosing.
Open-Source and Licensed Options
The choices below are examples, not a product ranking. Compare their fit for the question, data, deployment, and review process you need.
| Need | Open-source or self-managed | Commercial or managed | Where each may fit |
|---|---|---|---|
| Fairness and model explanations | Fairlearn and AI Fairness 360 provide group-fairness measures; SHAP explains feature contributions. | Azure Responsible AI dashboard combines fairness, interpretability, and error analysis. IBM watsonx.governance supports broader AI oversight. | Libraries suit teams building checks into their own pipeline; managed dashboards can fit teams already operating in that cloud. Governance suites help organise oversight but still require teams to select suitable measures. |
| Drift and performance monitoring | Evidently supports evaluation and monitoring; Alibi Detect covers drift and outlier detection across data types. | NannyML Cloud can estimate performance when labels are delayed. Azure ML monitoring fits managed Azure deployments. | Self-managed tools offer control but need operational ownership. Managed services can reduce platform work; verify model support, data residency, and how their metrics match your review needs. |
| Tracing AI applications and agents | Arize Phoenix supports traces, evaluation, and debugging. | Fiddler offers commercial AI application and agent evaluation; Arize AX is Arize’s managed enterprise platform. | Tracing tools help investigate application behavior across services. Add domain-specific fairness and outcome review where decisions affect people. |
For any option, check the exact metric definitions, integrations, operational support, cost, and data-handling terms. A tool can produce signals; your team still defines the review and response.
Reading Tool Results Before Acting
There is a reporting gap: if an outcome column is missing, this audit returns “passed” with null metrics; some library errors also log a warning and continue. Report a measured pass separately from a skipped or incomplete check.
The daily pipeline and weekly workflow both run this audit. Repeating a check does not independently validate it; compare their inputs and reports, and verify the outcome data is present before treating a “passed” status as a measured result.
Back to top . Next: Key Lessons Learnt
🎓 Key Lessons Learnt
Across fairness, scoring, drift, and data checks, the same discipline applies: record what the signal means, who reviewed it, and what happened next.
| Lesson | Recommendation |
|---|---|
| A fairness gap depends on labels and group definitions. | Check both before interpreting a difference. |
| Missing data can look like a passed check. | Separate measured results from incomplete runs. |
| A score contribution is not automatically a customer reason. | Check explanations against the decision and applicable notice rules. |
| Monitoring and incident triage can use different thresholds. | Test boundary values across both paths. |
| Flagged records may continue downstream. | Verify whether the control detects, holds, or blocks them. |
| A control needs a traceable outcome. | Link the run, reviewer decision, and follow-up evidence. |
Thank You, Reader
The configured 0.27 example is simple; tracing it from a monitoring result to a human decision is the harder part. Fairness, explanations, and drift checks matter when their results reach the people who must interpret and act on them. Thanks for reading.
Connect With Me
- LinkedIn: Connect on LinkedIn
- GitHub: github.com/neerajg5
- Blog: learnwithneeraj.com
Enjoyed this article?
Get notified when the next one is published.
We send one email per new article — no spam, unsubscribe any time.
⚠️ Disclaimer: The information provided on LearnWithNeeraj.com regarding Astrology, Numerology, and other topics is for educational and guidance purposes only.
Not Professional Advice: This content should not be used as a substitute for professional medical, legal, or financial advice. Always consult a certified professional for specific concerns.
Guest Authors: This site features articles by various contributors. The views and interpretations expressed are those of the individual authors and do not necessarily reflect the views of the website administrator.
Your destiny is in your hands. Use this information as a map, not a mandate.