📌 TL;DR
A development environment that doesn’t mirror production is a liability that compounds over time. In this part, I walk through the full Docker Compose stack that powers local development of the agentic data platform — twelve services, zero cloud accounts required. Every configuration decision follows 12-Factor App principles so the same codebase deploys from laptop to Kubernetes without modification.
⏮️ Previous: From Scripts to Sentience: Building an Agentic Data Platform | ⏭️ Next: Designing for Intelligence: The Agentic Data Pipeline Architecture →
⚠️ Why Environment Fidelity Matters More Than We Think
The most common source of “it works on my machine” disasters isn’t bad code — it’s environment drift. A developer tests against Kafka 3.4 locally while production runs 3.6. A compliance check passes locally because OPA is missing and the policy evaluation silently returns true. A performance regression ships because the local database has 500 rows while production has 50 million.
For an agentic data platform, environment fidelity is especially critical. Agents are stateful. Their behaviour depends on the services they can reach, the credentials they hold, and the policies they evaluate against. An agent tested in an environment missing half the services will exhibit unpredictable behaviour the first time it touches production.
The approach I take is to define the entire platform topology in a single Docker Compose file and make it the canonical runtime for local development, CI, and integration testing. No service is mocked unless it is explicitly untestable locally. No environment variable is hardcoded in application code.
↑ Back to top · Next: The Service Topology →
🗂️ The Service Topology
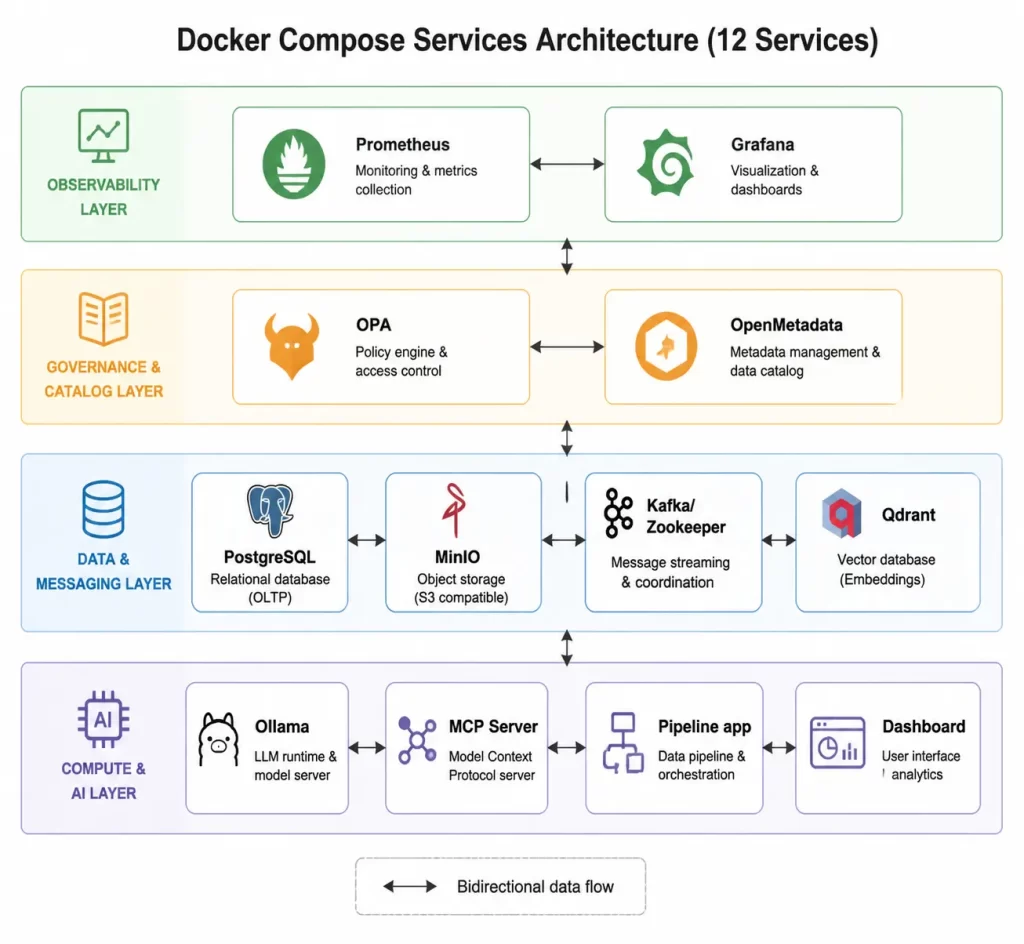
The platform runs twelve services under Docker Compose. Each service maps to a distinct architectural concern:
| Service | Image | Purpose |
|---|---|---|
postgres | postgres:15 | Transactional storage, LangGraph checkpointing |
minio | minio/minio | S3-compatible object storage, raw file landing zone |
kafka | confluentinc/cp-kafka | Event streaming, agent A2A message bus |
zookeeper | confluentinc/cp-zookeeper | Kafka coordination (required for Kafka <4.0) |
qdrant | qdrant/qdrant | Vector database for agent RAG memory |
ollama | ollama/ollama | Local LLM inference (Mistral/Llama) |
mcp-server | (built locally) | Internal tool registry for agent capabilities |
pipeline | (built locally) | The ETL pipeline application |
dashboard | (built locally) | Operational control UI |
prometheus | prom/prometheus | Metrics collection and storage |
grafana | grafana/grafana | Dashboard visualization and alerting |
openmetadata | openmetadata/server | Data catalog and lineage visualization |
This topology reflects the TOGAF Technology Architecture pattern: compute services (pipeline, mcp-server, dashboard), data services (postgres, minio, qdrant), messaging services (kafka, zookeeper), governance services (openmetadata, opa), and observability services (prometheus, grafana).
↑ Back to top · Next: The Docker Compose Structure →
🐳 The Docker Compose Structure
The Compose file is organized into three layers: infrastructure services that must start first, platform services that depend on infrastructure, and application services that consume everything below them. Every service follows the same three conventions — no exceptions.
Here is how a typical infrastructure service looks, using PostgreSQL as the example:
services:
  postgres:
    image: postgres:15
    environment:
      POSTGRES_DB: ${DB_NAME:-agentic_pfm}
      POSTGRES_USER: ${DB_USER:-user}
      POSTGRES_PASSWORD: ${DB_PASSWORD}        # no default — must be set explicitly
    volumes:
      - postgres_data:/var/lib/postgresql/data  # named volume: survives restarts
      - ./schema:/docker-entrypoint-initdb.d    # bind mount: schema runs on first start
    healthcheck:
      test: ["CMD-SHELL", "pg_isready -U ${DB_USER:-user}"]
      interval: 10s
      retries: 5
  # ... kafka, minio, qdrant, ollama follow the same pattern
All twelve services share three conventions that are worth spelling out:
- 🔒 No hardcoded secrets. Every sensitive value uses
${VAR:-default}syntax — a default is provided only where a weak local value is acceptable. Credentials that must never have a default (likeDB_PASSWORD) have no fallback. This is the 12-Factor App methodology’s third principle: store config in the environment, not in code. The 12-Factor App is a set of twelve principles for building portable, maintainable software-as-a-service applications — their core insight is that an application should be completely decoupled from the environment it runs in. - 💓 Health checks on every service. Application services declare
depends_on: condition: service_healthyrather than justdepends_on. Without health checks, Docker Compose starts services in declaration order regardless of readiness, causing race conditions where the pipeline tries to produce a Kafka message before the broker is listening. Health checks eliminate this entire class of intermittent failures from both local development and CI runs. - 📁 Named volumes for state, bind mounts for code. Data that must survive container restarts (database rows, MinIO objects, vector embeddings) lives in Docker-managed named volumes. Application source code and configuration files are bind-mounted from the host, so changes are immediately visible inside the running container without an image rebuild.
↑ Back to top · Next: Environment Variable Management →
⚙️ Environment Variable Management
The libs/common/config.py module is the single source of truth for all configuration. It defines the environment variable names as constants — so if a variable is ever renamed, there is exactly one place to update:
# Every configurable parameter is an environment variable — no hardcoded values
ENV_LLM_PROVIDER = "LLM_PROVIDER"              # "local" or cloud provider name
ENV_KAFKA_BOOTSTRAP_SERVERS = "KAFKA_BOOTSTRAP_SERVERS"
ENV_OPA_URL = "OPA_URL"
ENV_AGENT_NETWORK_MODE = "AGENT_NETWORK_MODE"  # "local" or "distributed"
# ... and so on for every service the platform talks to
This pattern has a practical benefit that becomes obvious at deployment time: the entire platform’s configuration surface is visible in one file. There are no magic strings scattered across a dozen modules. When an infrastructure engineer needs to know what environment variables the application expects, they read config.py — not a wiki page that may be out of date.
For local development, a .env file at the project root sets all values. For CI/CD, the same variables are injected by the pipeline runner. For production Kubernetes, they come from a secrets manager mounted as environment variables. The application code is identical in all three cases — only the values change.
📋 The .env file is .gitignored without exception. A .env.example file documents every variable with its purpose and a safe non-secret default. This file is committed to version control and acts as the contract between the platform team and any developer setting up for the first time.
↑ Back to top · Next: Service-Specific Configuration →
🔧 Service-Specific Configuration
📨 Kafka
Kafka is the backbone of the event-driven architecture. For local development, auto-topic creation is enabled (KAFKA_AUTO_CREATE_TOPICS_ENABLE: "true") so developers don’t need to manually create topics before running the pipeline. In production, this is disabled and topics are provisioned through infrastructure-as-code with explicit partition counts and replication factors.
The primary topic is agentic-transactions (configurable via KAFKA_TOPIC). Agent-to-agent messages use a separate topic, agent_a2a (configurable via AGENT_NETWORK_TOPIC), which allows monitoring agent communication independently of data traffic.
🪣 MinIO
MinIO is configured as an S3-compatible object store. The application uses the standard boto3/aiobotocore SDK with a custom endpoint URL pointing to the local MinIO instance:
AWS_ENDPOINT_URL=http://minio:9000
AWS_S3_FORCE_PATH_STYLE=true   # Required for MinIO path-style bucket addressing
AWS_USE_SSL=false               # Local development; production uses TLS
The S3_FORCE_PATH_STYLE setting is a common stumbling block when moving between AWS S3 (which uses virtual-hosted-style URLs) and MinIO (which uses path-style URLs by default).
🛡️ OPA
Open Policy Agent runs as a standalone service. The pipeline application communicates with it via HTTP:
OPA_URL=http://opa:8181
OPA_POLICY_PATH=agentic/allow
Rego policy files are mounted as a volume from the policies/ directory. Policy changes can be tested locally without rebuilding any Docker image — simply edit the .rego file and the OPA container picks up the change immediately (with --watch mode enabled).
🤖 Ollama
The local LLM service runs Ollama, which exposes an OpenAI-compatible API at http://ollama:11434/v1. The LLMProvider class in libs/agents/llm_provider.py abstracts the provider entirely:
# Switch from local to cloud by changing one env var
LLM_PROVIDER=local    # Uses Ollama at LLM_LOCAL_BASE_URL
LLM_PROVIDER=cloud    # Uses cloud provider at configured endpoint
This abstraction means developers can work entirely offline using a locally-pulled model (the default is mistral, approximately 4GB) and the CI/CD pipeline can run against a cloud provider without touching application code.
📊 Prometheus and Grafana
Prometheus is a pull-based metrics system — rather than having each service push metrics to a central collector, Prometheus periodically scrapes a /metrics HTTP endpoint on each service. This means every service is responsible for exposing accurate metrics, and Prometheus simply collects them on schedule. The prometheus.yml configuration declares which services to scrape:
global:
  scrape_interval: 15s      # Poll each service every 15 seconds

scrape_configs:
  - job_name: pipeline
    static_configs:
      - targets: ["pipeline:8000"]
  - job_name: mcp_server
    static_configs:
      - targets: ["mcp-server:8080"]
  # ... kafka, grafana, and other services follow the same pattern
Grafana is pre-configured with a Prometheus data source via provisioning files mounted at /etc/grafana/provisioning. Dashboards load immediately after docker compose up — there is no manual data source configuration step. Provisioning-as-code ensures every developer gets the same dashboard layout, and the dashboards can be version-controlled alongside the application code they monitor.
↑ Back to top · Next: Starting the Environment →
🚀 Starting the Environment
The startup sequence is deliberately minimal:
cp .env.example .env          # fill in the required credentials
docker compose up -d          # start all twelve services
docker compose exec ollama ollama pull mistral   # one-time model download (~4 GB)
After that, docker compose ps shows health status for each service. The pipeline will not attempt to connect to any service until its health check passes — so there is no need to manually wait or retry.
For developers who only need a subset of services, Docker Compose profiles allow starting subsets without modifying the Compose file:
docker compose --profile data up -d           # postgres, minio, kafka only
docker compose --profile observability up -d  # prometheus + grafana only
↑ Back to top · Next: Development Workflow →
🔄 Development Workflow
The 12-Factor App methodology shapes the entire development workflow, not just configuration. Principle VI (processes are stateless) means pipeline stages must not store session state in memory between runs — anything that needs to survive across invocations goes to PostgreSQL or MinIO. This makes the pipeline horizontally scalable. Principle IX (disposability) means the application starts quickly, handles shutdown signals gracefully, and can be killed mid-run without corrupting stored data — important for Kubernetes environments where pods are routinely evicted and restarted.
For day-to-day development:
- Edit application code in
libs/orapps/ - The bind-mounted source directory means changes are immediately visible inside the container without rebuilding
- Run a quick integration test:
docker compose exec pipeline python -m pytest tests/ -x - Check the Grafana dashboard at
http://localhost:3000for metrics impact
For schema changes:
- Edit the SQL file in
schema/ - The schema directory is mounted at
/docker-entrypoint-initdb.din the PostgreSQL container - This only runs on first container creation; for subsequent schema changes, use Alembic migrations
↑ Back to top · Next: Security Baseline →
🔐 Security Baseline
Even for local development, basic security hygiene matters. A developer who develops against a misconfigured local environment will eventually copy those patterns to production.
- 🚫 Never commit
.envto version control. The.gitignoreexcludes it. The.env.exampleshows the structure without secrets. - 🔑 Use non-default credentials. The
.env.exampleshows placeholder credentials (CHANGE_ME). Developers must set real values before starting the stack. A check in theMakefilewill warn if any credential is still set to the placeholder value. - 🌐 Service-to-service authentication. In local development, services communicate on an isolated Docker network and trust each other. The production deployment adds mTLS between services. The code is written to accept credentials via environment variable, so the same application code works in both environments.
↑ Back to top · Next: What You Have After This Setup →
✅ What You Have After This Setup
At the end of this setup you have a complete local platform ready for development:
- ✅ A PostgreSQL database with the pipeline schema ready for data ingestion
- ✅ A MinIO object store accessible at
http://localhost:9000with an S3-compatible API - ✅ A Kafka cluster with the transaction topic available
- ✅ A local LLM accessible to agents at
http://ollama:11434/v1 - ✅ OPA evaluating Rego policies from the local
policies/directory - ✅ Prometheus collecting metrics and Grafana ready to visualize them
- ✅ OpenMetadata available for data catalog and lineage registration
ℹ️ Every subsequent article in this series assumes this environment is running. The pipeline, governance, streaming, and agent code all rely on these services being accessible.
🙏 Thank You, Reader
Thank you for working through the environment setup. The tooling complexity here is real — twelve services is a lot to hold in your head — but this foundation pays dividends in every subsequent article. Once it runs, it just runs.
📫 Connect With Me
- 💼 LinkedIn: Connect with me on LinkedIn
- 💻 GitHub
↑ Back to top · Next: Key Takeaways →
🔑 Key Takeaways
- Development environments that don’t mirror production are liabilities — use Docker Compose to define the full topology locally and eliminate environment drift.
- 12-Factor App principles — especially config-in-environment and stateless processes — make the platform portable across development, CI, and production without code changes.
- Health checks on every service prevent race conditions that cause intermittent test failures; use
depends_on: condition: service_healthy, not justdepends_on. - The LLM provider abstraction (
LLM_PROVIDERenv var) allows switching between local Ollama and cloud inference without touching application code. - Security hygiene starts in development: no hardcoded secrets, no default credentials, service isolation from day one.
Enjoyed this article?
Get notified when the next one is published.
We send one email per new article — no spam, unsubscribe any time.
⚠️ Disclaimer: The information provided on LearnWithNeeraj.com regarding Astrology, Numerology, and other topics is for educational and guidance purposes only.
Not Professional Advice: This content should not be used as a substitute for professional medical, legal, or financial advice. Always consult a certified professional for specific concerns.
Guest Authors: This site features articles by various contributors. The views and interpretations expressed are those of the individual authors and do not necessarily reflect the views of the website administrator.
Your destiny is in your hands. Use this information as a map, not a mandate.