📌 TL;DR
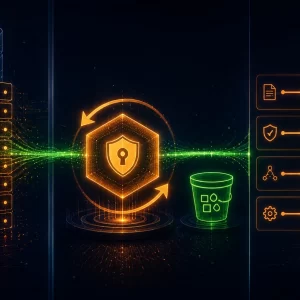
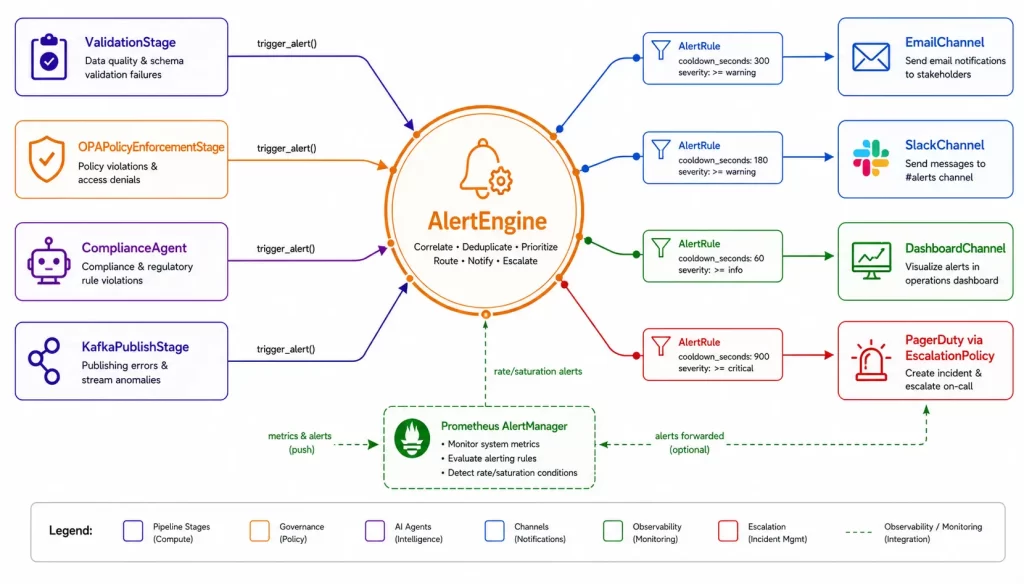
A platform that only reports problems when someone looks at a dashboard is a platform that is always behind. The alert system in this platform inverts that posture: it pushes signals to the right people through the right channels at the right severity level, without manual polling. This article covers the AlertEngine design, the rule and channel abstraction, escalation policies, how pipeline stages and agents inject alerts through a shared callback, and how Prometheus AlertManager handles time-based alerting alongside the platform’s own event-driven alerts.
⏮️ Previous: Trust Through Traceability: Advanced Validation and OpenLineage Integration → | ⏭️ Next: Seventeen Parts Later: Lessons From Building an Agentic Data Platform →
📖 Series context: In Part 15 — Trust Through Traceability, we built a layered validation architecture that detects schema errors, semantic failures, and statistical anomalies at ingestion — and emits OpenLineage provenance events so every record has an auditable lineage chain. This article routes those validation anomalies, governance denials, and agent compliance decisions into a centralised AlertEngine that pushes the right signal to the right people without manual dashboard polling. In Part 17 — Seventeen Parts Later: Lessons From Building an Agentic Data Platform, we close the series with the architectural decisions, trade-offs, and lessons learned that cut across all sixteen previous articles.
💡 Quick stats: 4 notification channels (Email, Slack, PagerDuty, Dashboard) in the same rule abstraction · cooldown_seconds=0 for governance denials — every denial is a compliance incident requiring documentation · PII recall below 95% fires immediately to both engineering and compliance channels
📖 In This Article
- The Problem With Passive Monitoring
- AlertEngine Architecture
- Notification Channels
- Escalation Policies
- Pipeline Integration via Alert Callback
- Agent Alert Integration
- Governance Alert Integration
- Prometheus AlertManager Integration
- Alert Fatigue Prevention
- MCP Server Alert Endpoints
- Frequently Asked Questions
- Key Takeaways
🚨 The Problem With Passive Monitoring
If you are operating a regulated financial data platform, Grafana dashboards alone are not enough — they only answer questions when someone is looking. For data engineers who need to be notified when validation fails, governance is denied, or PII recall drops below the GDPR compliance threshold, the platform needs an active alerting layer that pushes signals rather than waiting to be polled. This section explains why passive monitoring is structurally insufficient for compliance obligations.
The difference is posture. A dashboard answers the question “what is happening right now?” — but only if someone is looking. An alert system answers the question “what needs attention?” and delivers that answer to the person responsible, wherever they are.
For a financial data platform with compliance obligations, passive monitoring is insufficient:
- A validation failure that goes unnoticed for hours can mean a day’s worth of transactions with undetected data quality issues.
- A governance denial that is not escalated immediately may indicate a policy misconfiguration that is blocking legitimate transactions.
- A high-value transaction that enters the system without triggering the human approval gate is a compliance incident regardless of whether the transaction was legitimate.
The alert system addresses all three by routing events from every platform component — pipeline stages, agents, governance checks, the Kafka stack — through a central engine that evaluates rules and dispatches to the appropriate channels.
↑ Back to top · Next: AlertEngine Architecture →
🏗️ AlertEngine Architecture
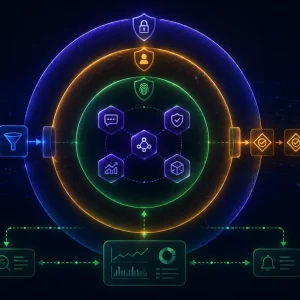
The AlertEngine hosted in the MCP server is the central collection point for all platform alerts:
from dataclasses import dataclass, field
from datetime import datetime
from enum import Enum
from typing import Callable

class AlertSeverity(str, Enum):
    CRITICAL = "critical"
    ERROR = "error"
    WARNING = "warning"
    INFO = "info"

@dataclass
class Alert:
    severity: AlertSeverity
    message: str
    source: str
    details: dict
    timestamp: datetime = field(default_factory=datetime.now)
    alert_id: str = field(default_factory=lambda: str(uuid.uuid4()))
    resolved: bool = False

@dataclass
class AlertRule:
    name: str
    condition: Callable[[Alert], bool]
    channels: list["NotificationChannel"]
    min_severity: AlertSeverity = AlertSeverity.WARNING
    cooldown_seconds: int = 300

    def matches(self, alert: Alert) -> bool:
        severity_order = [
            AlertSeverity.INFO,
            AlertSeverity.WARNING,
            AlertSeverity.ERROR,
            AlertSeverity.CRITICAL,
        ]
        meets_severity = (
            severity_order.index(alert.severity) >=
            severity_order.index(self.min_severity)
        )
        return meets_severity and self.condition(alert)

class AlertEngine:
    def __init__(self):
        self.rules: list[AlertRule] = []
        self.channels: list[NotificationChannel] = []
        self._alert_history: list[Alert] = []
        self._last_fired: dict[str, datetime] = {}

    def add_rule(self, rule: AlertRule) -> None:
        self.rules.append(rule)

    def trigger_alert(
        self,
        severity: str,
        message: str,
        source: str,
        details: dict,
    ) -> None:
        alert = Alert(
            severity=AlertSeverity(severity),
            message=message,
            source=source,
            details=details,
        )
        self._alert_history.append(alert)
        self._emit_prometheus_metric(alert)

        for rule in self.rules:
            if rule.matches(alert):
                if self._is_in_cooldown(rule.name):
                    continue
                for channel in rule.channels:
                    channel.send(alert)
                self._last_fired[rule.name] = datetime.now()

    def _is_in_cooldown(self, rule_name: str) -> bool:
        last = self._last_fired.get(rule_name)
        if last is None:
            return False
        elapsed = (datetime.now() - last).total_seconds()
        rule = next((r for r in self.rules if r.name == rule_name), None)
        return rule is not None and elapsed < rule.cooldown_seconds
The cooldown_seconds per rule is the primary defence against alert fatigue. A rule that fires on every validation issue in a batch can be configured with a 5-minute cooldown: the first firing notifies the team, and subsequent firings within that window are suppressed. After 5 minutes, the alert fires again if the condition still holds — confirming it is a sustained issue, not a transient spike.
↑ Back to top · Next: Notification Channels →
📢 Notification Channels
The channel abstraction decouples alert routing from alert dispatch. Any component that calls trigger_alert() does not need to know whether the alert will end up in an email, a Slack message, a PagerDuty incident, or a database record.
from abc import ABC, abstractmethod

class NotificationChannel(ABC):
    @abstractmethod
    def send(self, alert: Alert) -> None:
        ...

class EmailChannel(NotificationChannel):
    def __init__(self, smtp_config: dict, recipients: list[str]):
        self.smtp_config = smtp_config
        self.recipients = recipients

    def send(self, alert: Alert) -> None:
        subject = f"[{alert.severity.upper()}] {alert.source}: {alert.message[:80]}"
        body = self._format_body(alert)
        try:
            with smtplib.SMTP(
                self.smtp_config["host"],
                self.smtp_config.get("port", 587),
            ) as smtp:
                smtp.starttls()
                smtp.login(
                    self.smtp_config["username"],
                    self.smtp_config["password"],
                )
                msg = MIMEText(body, "plain")
                msg["Subject"] = subject
                msg["From"] = self.smtp_config["from"]
                msg["To"] = ", ".join(self.recipients)
                smtp.sendmail(self.smtp_config["from"], self.recipients, msg.as_string())
        except Exception as error:
            logger.error("Email alert failed: %s", error)

    def _format_body(self, alert: Alert) -> str:
        return (
            f"Severity: {alert.severity.upper()}\n"
            f"Source: {alert.source}\n"
            f"Time: {alert.timestamp.isoformat()}\n"
            f"Message: {alert.message}\n\n"
            f"Details:\n{json.dumps(alert.details, indent=2)}"
        )

class SlackChannel(NotificationChannel):
    def __init__(self, webhook_url: str, channel: str = "#data-alerts"):
        self.webhook_url = webhook_url
        self.channel = channel

    def send(self, alert: Alert) -> None:
        severity_emoji = {
            AlertSeverity.CRITICAL: ":rotating_light:",
            AlertSeverity.ERROR: ":red_circle:",
            AlertSeverity.WARNING: ":warning:",
            AlertSeverity.INFO: ":information_source:",
        }
        payload = {
            "channel": self.channel,
            "text": (
                f"{severity_emoji.get(alert.severity, '')} "
                f"*[{alert.severity.upper()}]* {alert.source}\n"
                f"{alert.message}"
            ),
            "attachments": [
                {
                    "color": self._severity_color(alert.severity),
                    "fields": [
                        {"title": k, "value": str(v), "short": True}
                        for k, v in alert.details.items()
                        if not isinstance(v, (dict, list))
                    ],
                    "ts": int(alert.timestamp.timestamp()),
                }
            ],
        }
        try:
            response = requests.post(self.webhook_url, json=payload, timeout=5)
            response.raise_for_status()
        except Exception as error:
            logger.error("Slack alert failed: %s", error)

    def _severity_color(self, severity: AlertSeverity) -> str:
        return {
            AlertSeverity.CRITICAL: "#FF0000",
            AlertSeverity.ERROR: "#FF6600",
            AlertSeverity.WARNING: "#FFCC00",
            AlertSeverity.INFO: "#36A64F",
        }.get(severity, "#AAAAAA")

class DashboardChannel(NotificationChannel):
    """Persists alerts to the database for display in the operational dashboard."""
    def send(self, alert: Alert) -> None:
        with SessionLocal() as session:
            alert_db = AlertDB(
                alert_id=alert.alert_id,
                severity=alert.severity,
                message=alert.message,
                source=alert.source,
                details=alert.details,
                timestamp=alert.timestamp,
                resolved=alert.resolved,
            )
            session.add(alert_db)
            session.commit()
Every deployment includes a DashboardChannel in all rules. This ensures that every alert, regardless of which other channels it routes to, appears in the operational dashboard. The Grafana-based dashboard queries the alerts database directly, giving operators a unified view of all alerts across all severity levels.
↑ Back to top · Next: Escalation Policies →
📶 Escalation Policies
Not all alerts need immediate human attention. Escalation policies define what happens when an alert is not acknowledged within a defined time window:
@dataclass
class EscalationPolicy:
    name: str
    initial_channels: list[NotificationChannel]
    escalation_channels: list[NotificationChannel]
    escalation_after_seconds: int = 1800  # 30 minutes default

    def execute(self, alert: Alert) -> None:
        for channel in self.initial_channels:
            channel.send(alert)

        threading.Timer(
            self.escalation_after_seconds,
            self._escalate_if_unresolved,
            args=[alert],
        ).start()

    def _escalate_if_unresolved(self, alert: Alert) -> None:
        if not alert.resolved:
            escalation_alert = Alert(
                severity=AlertSeverity.CRITICAL,
                message=f"ESCALATED (unresolved after {self.escalation_after_seconds // 60}m): {alert.message}",
                source=f"EscalationPolicy/{self.name}",
                details={**alert.details, "original_alert_id": alert.alert_id},
            )
            for channel in self.escalation_channels:
                channel.send(escalation_alert)
The financial platform defines two escalation policies:
- 🔶 Data quality escalation: Validation errors route to the Slack
#data-alertschannel initially. If unresolved after 30 minutes, they escalate to the on-call engineer via PagerDuty. - 🔴 Compliance escalation: Governance denials route to Slack immediately. Any governance denial that remains unresolved after 15 minutes escalates to the compliance officer by email. This reflects the regulatory requirement that compliance incidents must be acknowledged and documented within a defined timeframe.
↑ Back to top · Next: Pipeline Integration via Alert Callback →
🔌 Pipeline Integration via Alert Callback
Every pipeline stage that can generate alerts receives an alert_callback through its configuration. This inversion of control keeps the alert dispatch logic in the AlertEngine while letting each stage raise alerts through a simple function call:
def build_pipeline(alert_engine: AlertEngine) -> PipelineRunner:
    alert_callback = alert_engine.trigger_alert

    stages = [
        TransactionGenerationStage(),
        PIIScrubberStage(),
        ValidationStage(config={"alert_callback": alert_callback}),
        OPAPolicyEnforcementStage(config={
            "alert_callback": alert_callback,
            "fail_on_policy_error": True,
        }),
        DataIngestionStage(),
        LineageRegistryStage(),
        AuditLoggingStage(),
        KafkaPublishStage(config={"alert_callback": alert_callback}),
    ]
    return PipelineRunner(stages=stages)
From the ValidationStage‘s perspective, raising an alert is a single line:
self.alert_callback(
    severity="error",
    message=f"Batch {batch_id} has {len(blocking_issues)} blocking validation failures",
    source="ValidationStage",
    details={"issues": [i.to_dict() for i in blocking_issues]},
)
The stage does not know which channels the alert will reach. It does not know whether the alert will be suppressed by a cooldown. It does not know whether an escalation policy is configured. All of that is the AlertEngine‘s responsibility.
This separation has an important testing benefit: stages can be unit-tested with a mock callback that collects alerts, and the AlertEngine can be tested independently with synthetic alerts. Neither test requires the full stack to be running.
↑ Back to top · Next: Agent Alert Integration →
🤖 Agent Alert Integration
The LangGraph orchestrator and individual agents raise alerts through the same callback:
def compliance_node(state: AgentState) -> AgentState:
    decision = compliance_agent.evaluate(state["transactions"])
    state["compliance_decision"] = decision

    if not decision.get("approved"):
        state["alert_callback"](
            severity="warning",
            message=f"Compliance evaluation denied {len(state['transactions'])} transactions",
            source="ComplianceAgent",
            details={
                "reason": decision.get("reason"),
                "policy_rule": decision.get("policy_rule"),
                "batch_id": state.get("batch_id"),
            },
        )
    return state
Routing the agent’s alert through the same AlertEngine instance that handles pipeline alerts means compliance denials appear in the same #data-alerts Slack channel as validation errors — no separate monitoring configuration for the agent layer.
↑ Back to top · Next: Governance Alert Integration →
⚖️ Governance Alert Integration
The governance stage raises specific alerts for OPA denial types, enabling rules that route different denial reasons to different channels:
class OPAPolicyEnforcementStage(PipelineStage):
    def execute(self, data, pipeline_context):
        ...
        if not decision.get("allow"):
            if self.alert_callback:
                self.alert_callback(
                    severity="error",
                    message="OPA governance denied pipeline write",
                    source="OPAPolicyEnforcementStage",
                    details={
                        "batch_id": pipeline_context.get("batch_id"),
                        "denial_reason": decision.get("reason"),
                        "policy_path": self.policy_path,
                        "input_summary": {
                            "contains_pii": pipeline_context.get("contains_pii"),
                            "pii_scrubbed": pipeline_context.get("pii_scrubbed"),
                            "audit_logged": pipeline_context.get("audit_logged"),
                        },
                    },
                )
The corresponding AlertRule routes OPA denials to the compliance officer’s channel rather than the general data alerts channel:
compliance_rule = AlertRule(
    name="opa_governance_denial",
    condition=lambda alert: (
        alert.source == "OPAPolicyEnforcementStage" and
        alert.severity in (AlertSeverity.ERROR, AlertSeverity.CRITICAL)
    ),
    channels=[
        DashboardChannel(),
        SlackChannel(webhook_url=SLACK_WEBHOOK, channel="#compliance-alerts"),
        EmailChannel(smtp_config=SMTP_CONFIG, recipients=[COMPLIANCE_OFFICER_EMAIL]),
    ],
    min_severity=AlertSeverity.ERROR,
    cooldown_seconds=0,  # Governance denials always notify; no cooldown
)
The cooldown_seconds=0 for governance denials is intentional. Unlike validation warnings, where a single notification per burst is sufficient, governance denials are individual incidents that each require documentation. Every denial must reach the compliance officer.
↑ Back to top · Next: Prometheus AlertManager Integration →
📊 Prometheus AlertManager Integration
The platform’s Prometheus AlertManager handles time-series-based alerting alongside the event-driven AlertEngine. The two systems cover complementary failure modes:
- ⚡ AlertEngine handles event-driven alerts: a specific batch failed validation, a governance rule fired, an agent raised an anomaly. These are discrete events with known timestamps.
- 📈 Prometheus AlertManager handles rate and saturation alerts: validation errors are occurring at an elevated rate over the last 15 minutes, consumer lag has been above the SLA threshold for 10 minutes, the pipeline has not produced records in the last 30 minutes. These are conditions that can only be detected by observing a metric over time.
The AlertManager configuration for the platform’s key alerts:
groups:
  - name: pipeline_alerts
    rules:
      - alert: ValidationErrorRateHigh
        expr: rate(pipeline_validation_issues_total{blocking="True"}[15m]) > 0.1
        for: 5m
        labels:
          severity: error
          team: data-platform
        annotations:
          summary: "High rate of blocking validation errors"
          description: >
            Blocking validation errors at {{ $value | humanize }} per second
            over the last 15 minutes. Investigate data source quality.

      - alert: KafkaConsumerLagCritical
        expr: kafka_consumer_lag_sum{consumer_group="pipeline-consumer"} > 10000
        for: 10m
        labels:
          severity: critical
          team: data-platform
        annotations:
          summary: "Kafka consumer lag above SLA threshold"
          description: >
            Consumer group {{ $labels.consumer_group }} lag is {{ $value }} messages.
            Pipeline may be falling behind data ingestion rate.

      - alert: PipelineStalled
        expr: increase(pipeline_records_processed_total[30m]) == 0
        for: 5m
        labels:
          severity: critical
          team: data-platform
        annotations:
          summary: "Pipeline has not processed records in 30 minutes"
          description: >
            No records processed by the pipeline in the last 30 minutes.
            Possible pipeline halt or data source failure.

      - alert: PIIRecallBelowThreshold
        expr: pii_scrubber_recall_ratio < 0.95
        for: 1m
        labels:
          severity: critical
          team: compliance
        annotations:
          summary: "PII detection recall below GDPR compliance threshold"
          description: >
            PII scrubber recall is {{ $value | humanizePercentage }}.
            GDPR compliance requires >= 95%. Immediate investigation required.
The PIIRecallBelowThreshold alert is the most compliance-sensitive rule in the stack. If the PII scrubber’s recall drops below 95% — meaning more than 5% of PII-containing memos are not being scrubbed — the platform may be writing unprotected personal data to staged_data. This alert fires immediately and routes to the compliance officer in addition to the engineering team.
↑ Back to top · Next: Alert Fatigue Prevention →
🛡️ Alert Fatigue Prevention
Alert fatigue — the condition where so many alerts fire that operators start ignoring them — is as dangerous as no alerts at all. The platform uses three mechanisms to prevent it:
- ⏱️ Rule-level cooldowns: The
cooldown_secondsparameter inAlertRulesuppresses duplicate notifications for the same condition within a time window. A validation error rule with a 5-minute cooldown will notify once per burst of errors, not once per record. - 🎚️ Severity discipline:
INFOalerts are never routed to interrupt channels (Slack, PagerDuty, email). They are written to the dashboard only.WARNINGalerts go to Slack.ERRORalerts go to Slack and email.CRITICALalerts go to all channels including PagerDuty. This means an on-call engineer is only paged for conditions that genuinely require immediate action. - ✅ Resolved notifications: When a condition clears — the pipeline resumes processing, validation errors stop — the system sends a resolved notification to the same channels that received the firing notification. This closes the loop for the operator and prevents confusion about whether a previously alerted condition is still active.
def resolve_alert(self, alert_id: str) -> None:
    with SessionLocal() as session:
        alert_db = session.query(AlertDB).filter_by(alert_id=alert_id).first()
        if alert_db:
            alert_db.resolved = True
            alert_db.resolved_at = datetime.now()
            session.commit()

    resolved_alert = Alert(
        severity=AlertSeverity.INFO,
        message=f"RESOLVED: {alert_db.message}",
        source=f"AlertEngine/resolution",
        details={"original_alert_id": alert_id},
    )
    for rule in self.rules:
        if rule.matches(resolved_alert):
            for channel in rule.channels:
                channel.send(resolved_alert)
↑ Back to top · Next: MCP Server Alert Endpoints →
🖥️ MCP Server Alert Endpoints
The MCP server exposes alert management endpoints consumed by the operational dashboard:
@router.get("/api/alerts")
async def list_alerts(
    severity: str | None = None,
    source: str | None = None,
    resolved: bool = False,
    limit: int = 100,
) -> list[AlertResponse]:
    """Return recent alerts, optionally filtered by severity, source, or resolution status."""
    with SessionLocal() as session:
        query = session.query(AlertDB).filter_by(resolved=resolved)
        if severity:
            query = query.filter_by(severity=severity)
        if source:
            query = query.filter_by(source=source)
        alerts = query.order_by(AlertDB.timestamp.desc()).limit(limit).all()
        return [a.to_response() for a in alerts]

@router.post("/api/alerts/{alert_id}/resolve")
async def resolve_alert(alert_id: str) -> dict:
    """Mark an alert as resolved and send resolution notifications."""
    alert_engine.resolve_alert(alert_id)
    return {"status": "resolved", "alert_id": alert_id}

@router.get("/api/alerts/summary")
async def alert_summary() -> dict:
    """Return counts of unresolved alerts by severity for the dashboard header."""
    with SessionLocal() as session:
        counts = (
            session.query(AlertDB.severity, func.count(AlertDB.alert_id))
            .filter_by(resolved=False)
            .group_by(AlertDB.severity)
            .all()
        )
        return {severity: count for severity, count in counts}
The /api/alerts/summary endpoint powers the alert badge in the dashboard header — the count of unresolved critical and error alerts that operators see at a glance when they open the dashboard. It is polled every 30 seconds by the dashboard frontend.
↑ Back to top · Next: Key Takeaways →
❓ Frequently Asked Questions
Common questions about building alert systems for agentic data pipelines answered from real-world implementation experience.
What is the difference between event-driven alerting and Prometheus AlertManager?
Event-driven alerting (via the AlertEngine) fires on discrete, timestamped events: a specific validation batch failed, a governance rule denied a write, an agent raised an anomaly. These events happen at a known moment and require immediate notification. Prometheus AlertManager fires on sustained conditions detected in time-series metrics: validation errors have been occurring at an elevated rate for 15 minutes, Kafka consumer lag has exceeded the SLA threshold for 10 minutes. The two systems cover complementary failure modes — neither replaces the other.
How do you prevent alert fatigue in a data pipeline monitoring system?
Three mechanisms work together: per-rule cooldowns suppress duplicate notifications for the same condition within a time window (e.g., 5-minute cooldown on validation error rules notifies once per burst, not once per record); severity discipline restricts interrupt channels — only CRITICAL alerts page PagerDuty, while INFO writes to the dashboard only; and resolved notifications close the loop by sending a “this condition cleared” message to the same channels that received the firing alert, preventing confusion about whether a problem is still active.
Why should governance denial alerts have zero cooldown?
Unlike validation warnings — where a single notification per burst is sufficient because the root cause is typically a data source issue affecting an entire batch — governance denials are individual compliance incidents. Each denial means a specific batch was blocked for a specific policy reason that must be documented. A cooldown on governance denials would suppress notifications for denials 2 through N in a burst, creating undocumented compliance incidents. cooldown_seconds=0 ensures every denial reaches the compliance officer channel without suppression.
How do you integrate an alert system with pipeline stages without tight coupling?
The platform uses inversion of control via an alert callback: the AlertEngine exposes its trigger_alert() method as a callable that is injected into each pipeline stage’s configuration at startup. The stage calls self.alert_callback(severity, message, source, details) — it does not import or reference the AlertEngine directly. This means stages can be unit-tested with a mock callback that collects alerts, and the AlertEngine can be tested independently with synthetic alerts, without the full pipeline stack running.
↑ Back to top · Next: Key Takeaways →
🔑 Key Takeaways
- AlertEngine with rules and channels decouples alert production from dispatch — pipeline stages call a callback with severity, message, source, and details; the engine decides which channels fire, which rules suppress by cooldown, and which escalation policies apply — stages need not know any of this.
- Per-rule cooldowns prevent alert fatigue for high-frequency conditions — a 5-minute cooldown on validation error rules notifies once per burst rather than once per record; governance denial rules must use
cooldown_seconds=0because every denial is a distinct compliance incident requiring documentation. - Escalation policies enforce acknowledgment SLAs automatically — data quality alerts escalate to PagerDuty after 30 minutes unresolved; compliance denials escalate to the compliance officer by email after 15 minutes — no human has to remember to follow up.
- Event-driven AlertEngine and Prometheus AlertManager cover complementary failure modes — use event alerts for discrete failures with a known timestamp and use Prometheus for sustained conditions only detectable by observing a metric over a window of time.
- Severity discipline determines which channels an alert reaches —
INFOwrites to the dashboard only;WARNINGgoes to Slack;ERRORgoes to Slack and email;CRITICALgoes to all channels including PagerDuty; an on-call engineer who ignores alerts because most are low-value is as dangerous as no alerting at all. - PII recall below 95% is a compliance incident, not a data quality metric — it routes to the compliance officer channel in addition to the engineering channel, because a recall drop means unprotected personal data may be reaching
staged_datain violation of GDPR obligations.
🙏 Thank You, Reader
If this article helped you think about alerting as a first-class architectural concern rather than an afterthought, that’s what it was written for. A platform that surfaces the right signal to the right person at the right time is a platform that scales — because the humans operating it aren’t buried in noise.
📫 Connect With Me
- 💼 LinkedIn: Connect with me on LinkedIn
- 💻 GitHub
Enjoyed this article?
Get notified when the next one is published.
We send one email per new article — no spam, unsubscribe any time.
⚠️ Disclaimer: The information provided on LearnWithNeeraj.com regarding Astrology, Numerology, and other topics is for educational and guidance purposes only.
Not Professional Advice: This content should not be used as a substitute for professional medical, legal, or financial advice. Always consult a certified professional for specific concerns.
Guest Authors: This site features articles by various contributors. The views and interpretations expressed are those of the individual authors and do not necessarily reflect the views of the website administrator.
Your destiny is in your hands. Use this information as a map, not a mandate.